Setting Baseline Metrics
Why establishing precise baseline metrics is the critical first step to distinguishing repeatable manufacturing success from random luck.
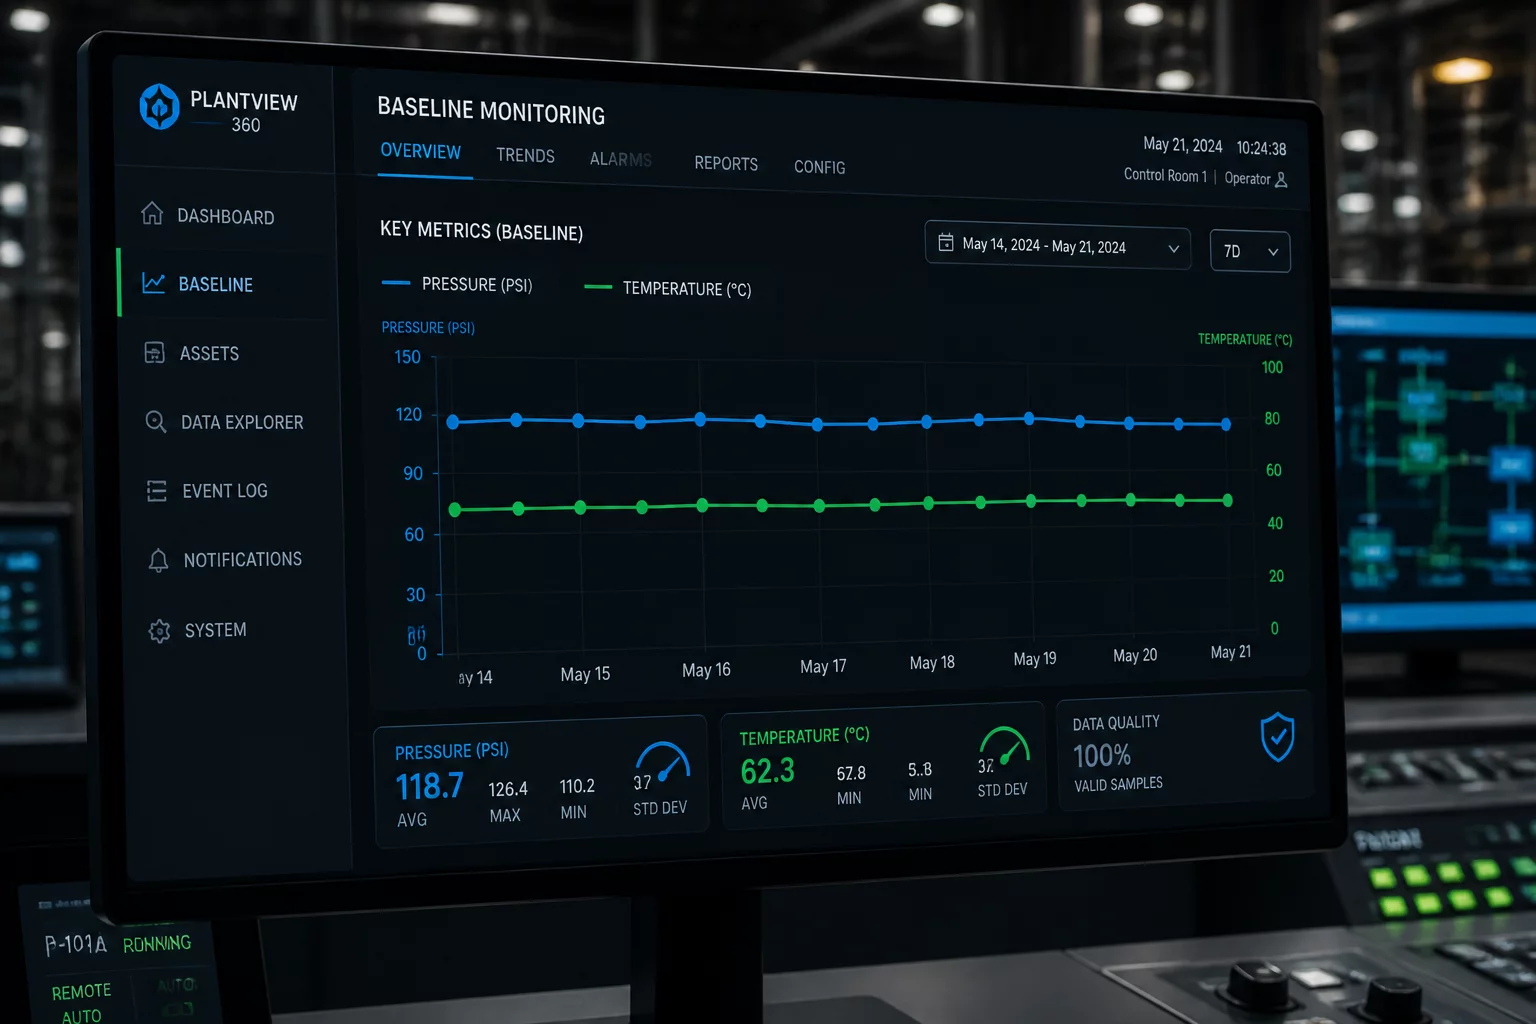
In any manufacturing environment, consistency is the ultimate goal. However, achieving repeatability is impossible without first understanding where your process currently stands. When we began our small-batch production tests, we quickly realized that a single successful print was not proof of a stable process. To establish a reliable standard, we designed a comprehensive system for setting baseline metrics. This framework allowed us to isolate variables, measure dimensional accuracy systematically, and determine whether variations were within acceptable tolerance thresholds.
Overview & Objective
The primary objective of this initiative was to create a statistical benchmark for our 3D printed components. In mechanical engineering, a baseline represents the reference point from which all future performance, wear, and dimensional drift are measured. Without this reference, any calibration adjustment is merely a guess. We focused on measuring key physical attributes: outer diameters, wall thicknesses, and hole alignments. Our goal was to gather enough empirical data to define what "normal" looked like for our machines under standard operating conditions. By documenting these parameters across dozens of initial runs, we established a clear baseline that separated normal process noise from actual mechanical errors.
If you cannot measure your starting point with absolute accuracy, you cannot claim your final product is consistent. The baseline is the only truth in production.
— Rachel Adams, Technical Lead
Implementation & Methodology
We implemented our methodology using a strict three-phase testing cycle. First, we ran twenty test specimens using a standardized material batch under controlled ambient conditions. Each part was allowed to cool completely before being measured with digital calipers and go/no-go gauges. Second, we recorded the data points into a centralized tracking matrix, looking specifically for thermal shrinkage and layer-height deviation. Finally, we analyzed the statistical variance. This methodology helped us identify that our standard printer setup had a consistent shrinkage rate of 0.8% along the X-axis, allowing us to build precise compensation factors directly into our slicing software profiles.
Key Takeaways & Lessons
Establishing baseline metrics taught us several key lessons. Most importantly, we discovered that ambient room temperature had a far greater impact on dimensional consistency than we had initially anticipated. A five-degree fluctuation in the workshop led to a measurable variance in interlayer bonding and minor warping. Additionally, we realized that relying on automatic calibration tools without manual verification can introduce subtle errors over time. By establishing these baselines, our engineering team gained the ability to confidently sign off on batch approvals and troubleshoot production anomalies in minutes rather than days.
Discussion & Input
Add Your Analysis